Pagewise, a product page insights dashboard
A concept dashboard that helps an e-commerce team decide which product pages to fix first, and what to do about them.
- B2B
- Dashboard
- Data visualisation
Try the prototype
A working prototype with sample data. Change the date range, device or category, sort the table, and open any product to see its drill-down.
The idea
E-commerce teams have plenty of product page data: views, add-to-bag rates, returns, reviews. What they rarely have is a clear answer to the question that matters on a Monday morning: which pages should we fix first, and what should we do?
Pagewise is a concept dashboard built around that question. Working on product pages, search and checkout for fashion retailers showed me how often the numbers live in separate tools, owned by separate teams. This concept pulls them into one view and turns them into decisions.
Ranked by impact, not by alarm
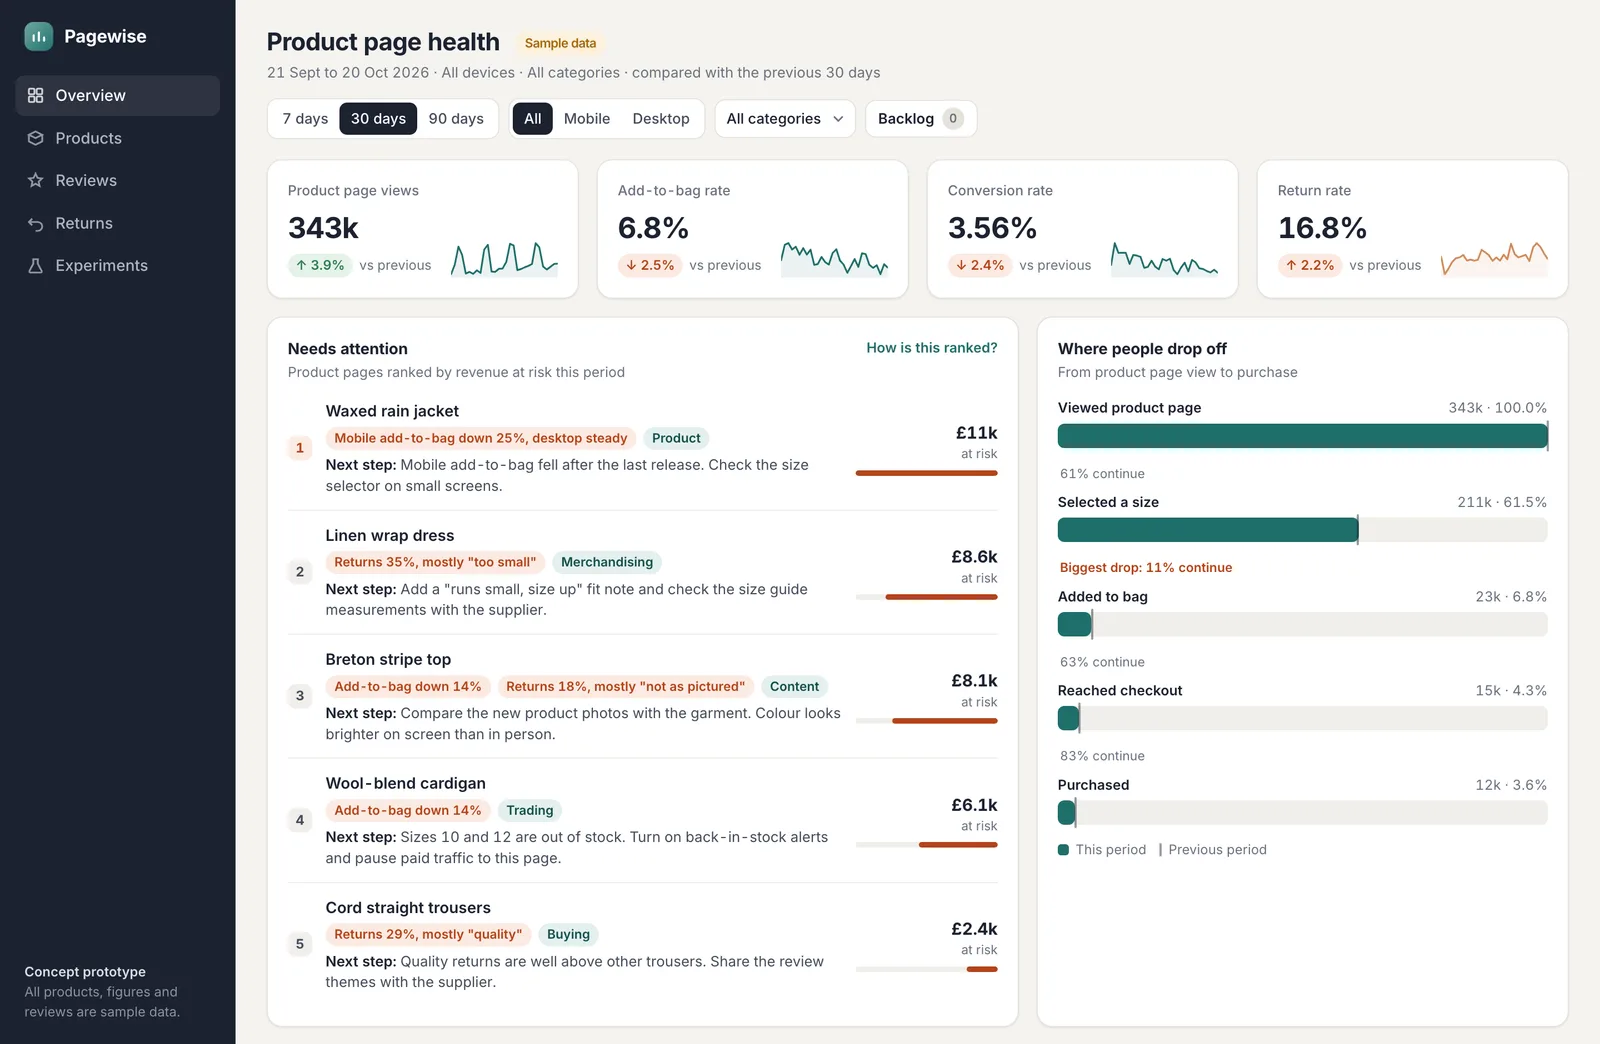
The Needs attention list ranks product pages by revenue at risk. It adds two things: sales lost from a fall in add-to-bag rate, and the cost of returns above the category's usual rate. That keeps small, frequent problems from hiding behind dramatic, rare ones.
Each item says what changed in plain words ("Mobile add-to-bag down 25%, desktop steady"), names the team who owns the fix, and suggests a next step. A short "How is this ranked?" note explains the scoring, so people can trust it or challenge it.
From signal to cause
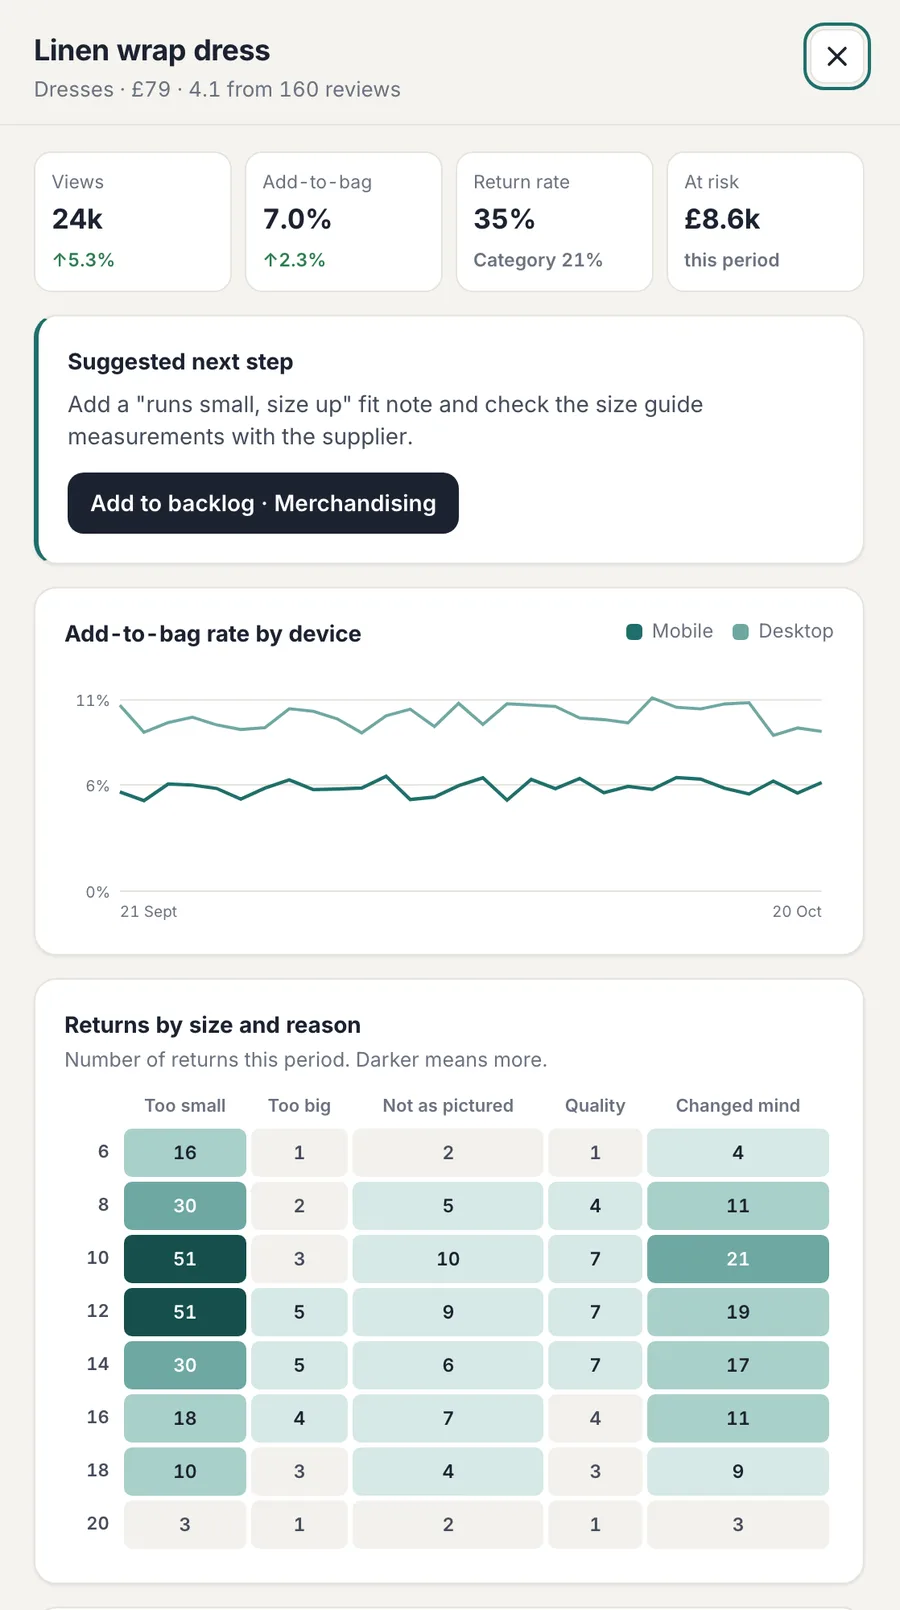
Opening a product shows the evidence behind its ranking. Add-to-bag is split by device, so a mobile-only drop stands out straight away. A heatmap of returns by size and reason shows whether a dress runs small across the range or only in certain sizes. Review themes show what customers keep mentioning, positive and negative.
The next step can go straight into the owning team's backlog from there, so the dashboard ends in an action rather than a screenshot in a slide deck.
Dense, but readable
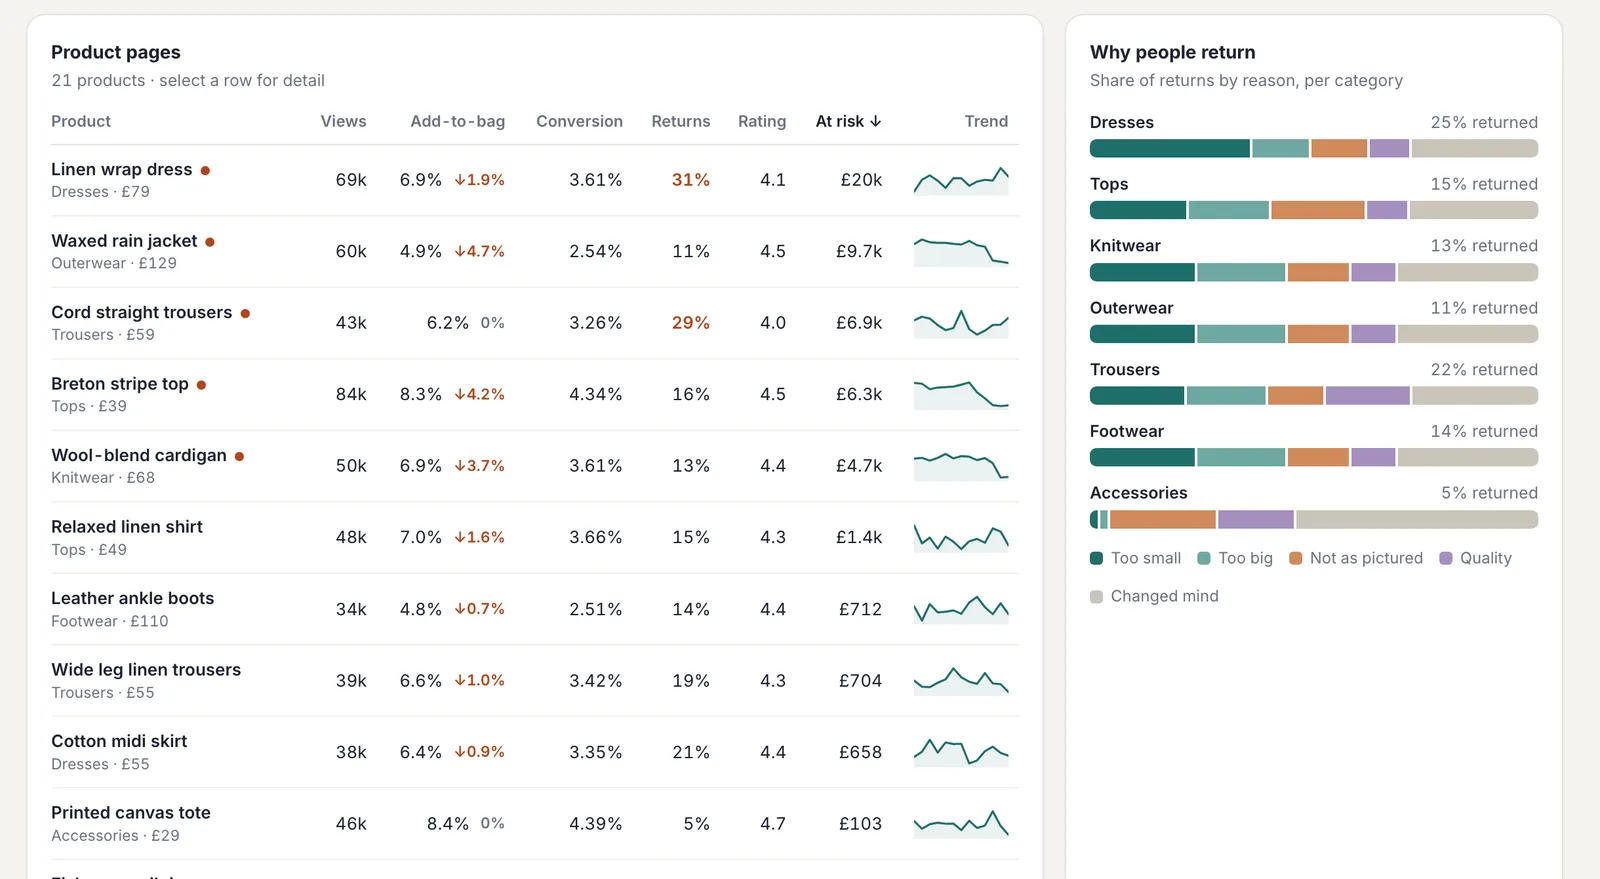
The product table packs eight columns into each row, so it relies on hierarchy rather than decoration: tabular figures, right-aligned numbers, colour only where something needs attention, and a small trend line instead of another chart.
Charts carry text alternatives, colour is never the only signal (changes also get arrows and words), the table sorts by keyboard, and the layout reflows down to a phone screen. All products, figures and reviews are sample data.