Testing our way to a better category page
A structured A/B programme to settle long-running arguments about filters, density and sort, using customer behaviour instead of the loudest opinion.
- A/B Testing
- PLP
Focus
The category page had been redesigned three times in two years on instinct alone. Conversion was flat, average order value was flatter, and every internal stakeholder had a different theory.
Constraints
- All variants had to ship through the existing front-end framework
- Sample sizes were tight outside of peak, which required careful audience selection
- No changes to product card imagery during the test window
- Tests had to read cleanly to non-technical stakeholders in a Friday review
Context
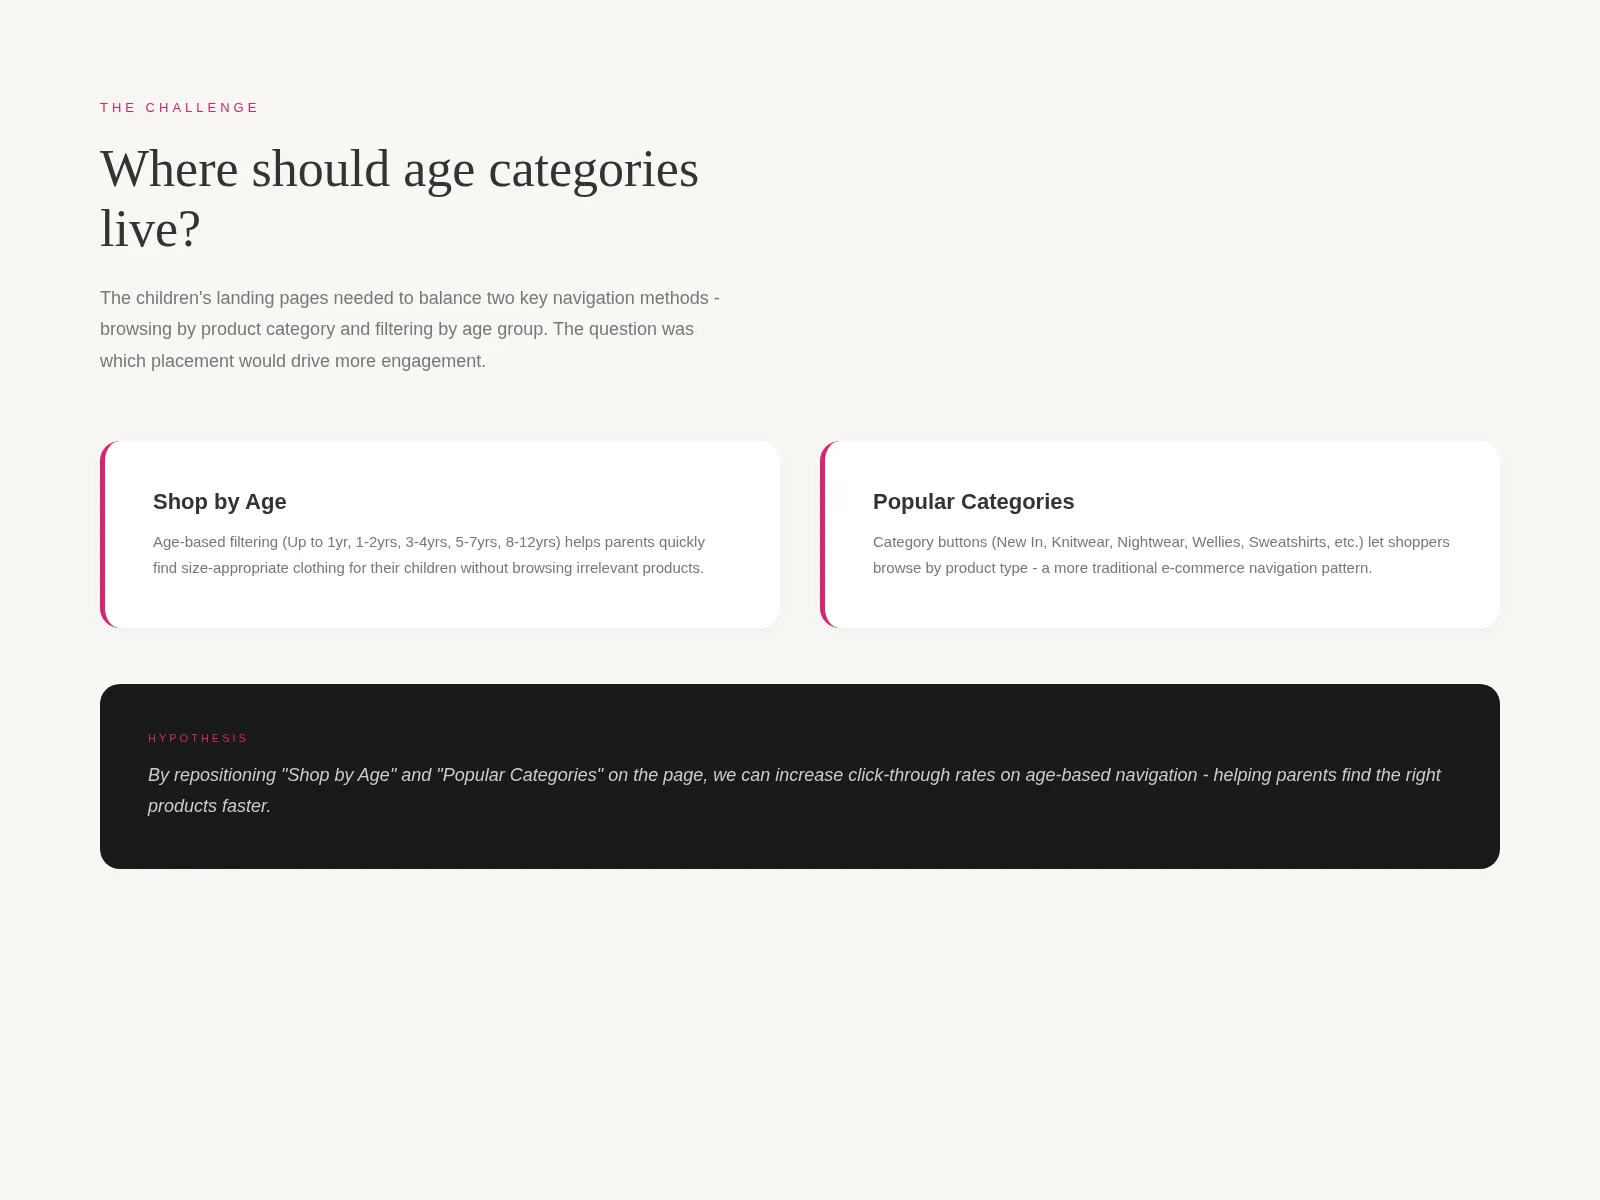
For a category page that was generating a meaningful slice of revenue, the Joules team was making decisions about it on vibes. There were strong opinions in every direction: merchandising wanted larger imagery, the trading team wanted more products visible, and mobile users were getting whatever scraps were left after both groups argued. Conversion, meanwhile, had been flat for the better part of a year.
I was asked to lead a structured testing programme. The brief was intentionally broad: pick the questions worth answering, design the variants, and turn the results into a recommendation the business would actually act on.
Approach
I spent the first two weeks doing two things in parallel. First, mapping out every change anyone had proposed for the category page in the previous twelve months: about thirty items, ranging from “bigger filter chips” to “remove the sort dropdown entirely”. Second, looking at heatmaps and segment-level conversion data to figure out which of those proposals had any chance of moving the metrics that mattered.
That filtering exercise narrowed thirty ideas down to six worth testing. I wrote each one up as a single-page hypothesis: what we believe, why, what we’d measure, what we’d need to see to call it a win. The six covered three areas: filter mechanics, product card density, and default sort.
Decisions
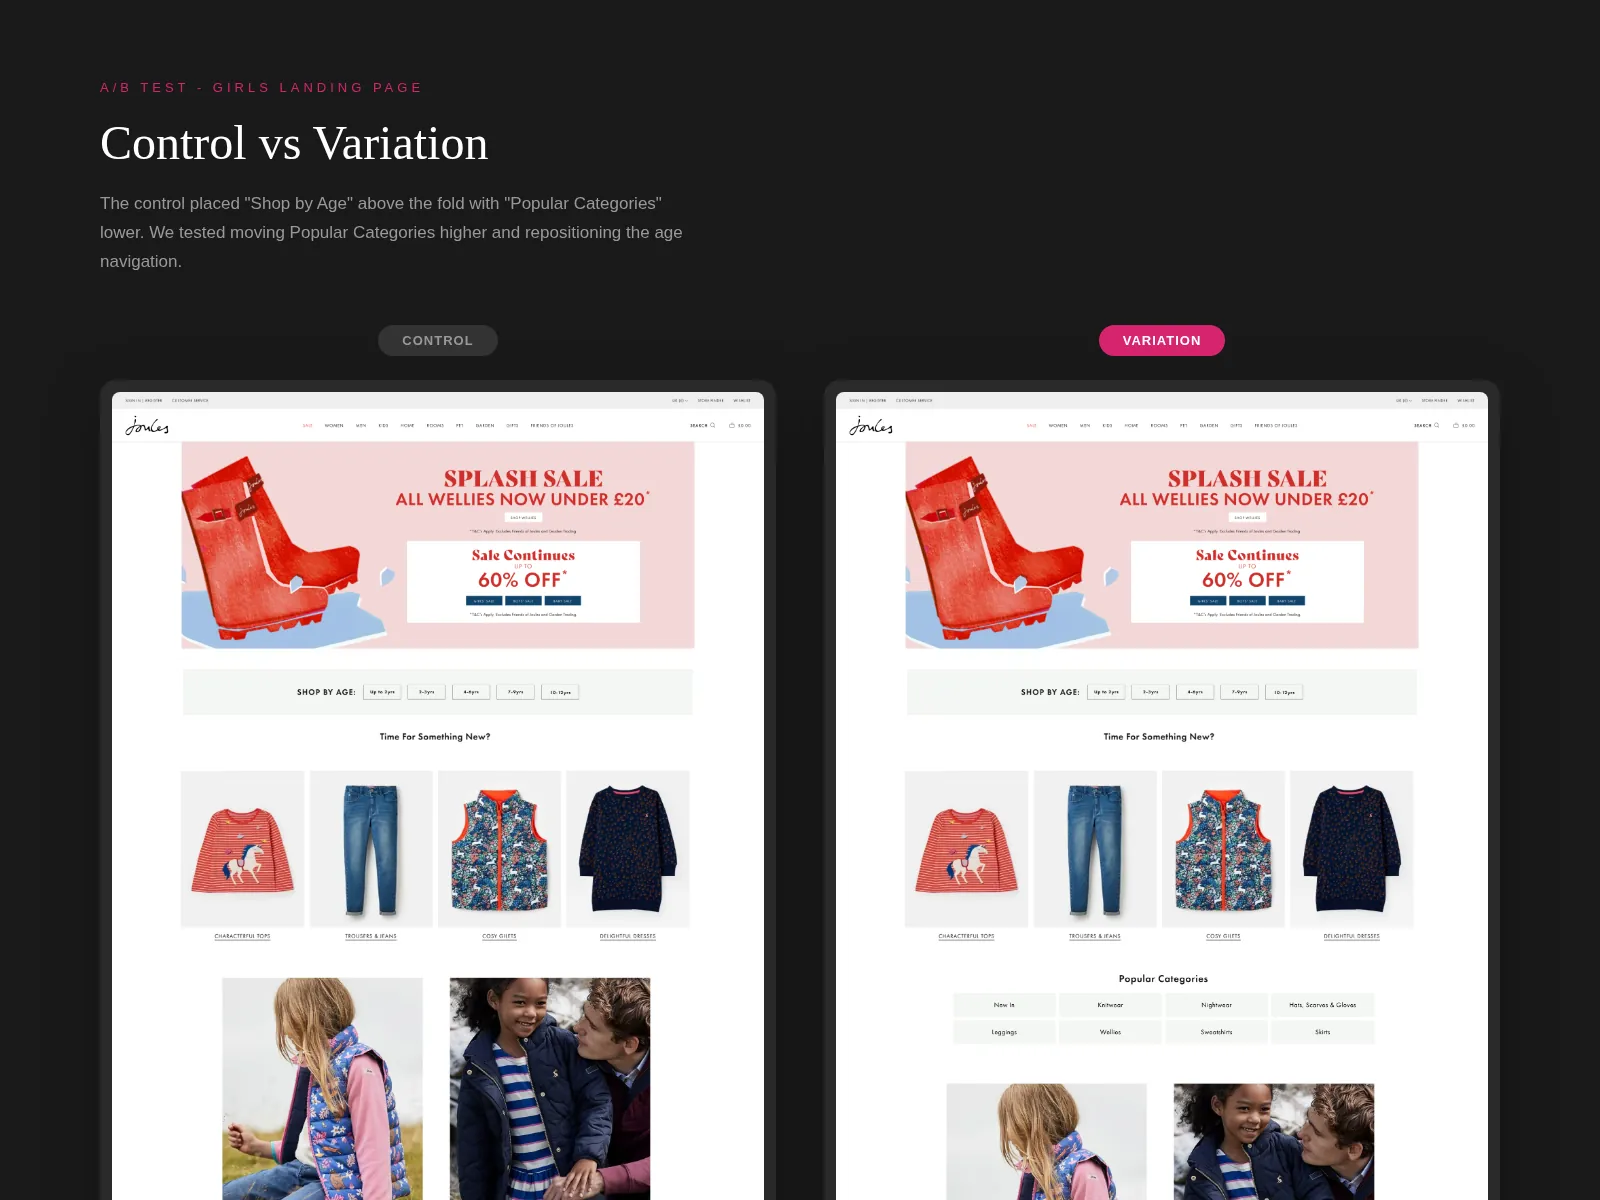
The decision I am still proudest of was not running every test simultaneously. There was pressure to parallelise, and I pushed back. Joules’ traffic outside peak was tight enough that overlapping experiments would muddy the read on each other. We ran them sequentially, two weeks each, with a one-week wash period between them. It cost time but it bought clean data.
I also pushed for mobile-first variants in every test. Three of the six original proposals had been written with desktop in mind, and I rebuilt them for the smaller viewport before building back up. The dense-grid variant in particular only made sense once it had been redesigned with thumb reach and one-handed scroll in mind.
Sort defaulting was the most contested. Merchandising wanted “Newest”, trading wanted “Bestselling”, and the data already suggested that bestsellers were already over-served. We tested a third option, “Recommended” (a mix weighted toward recent strong performers), and gave it a fair shot.
Iterations
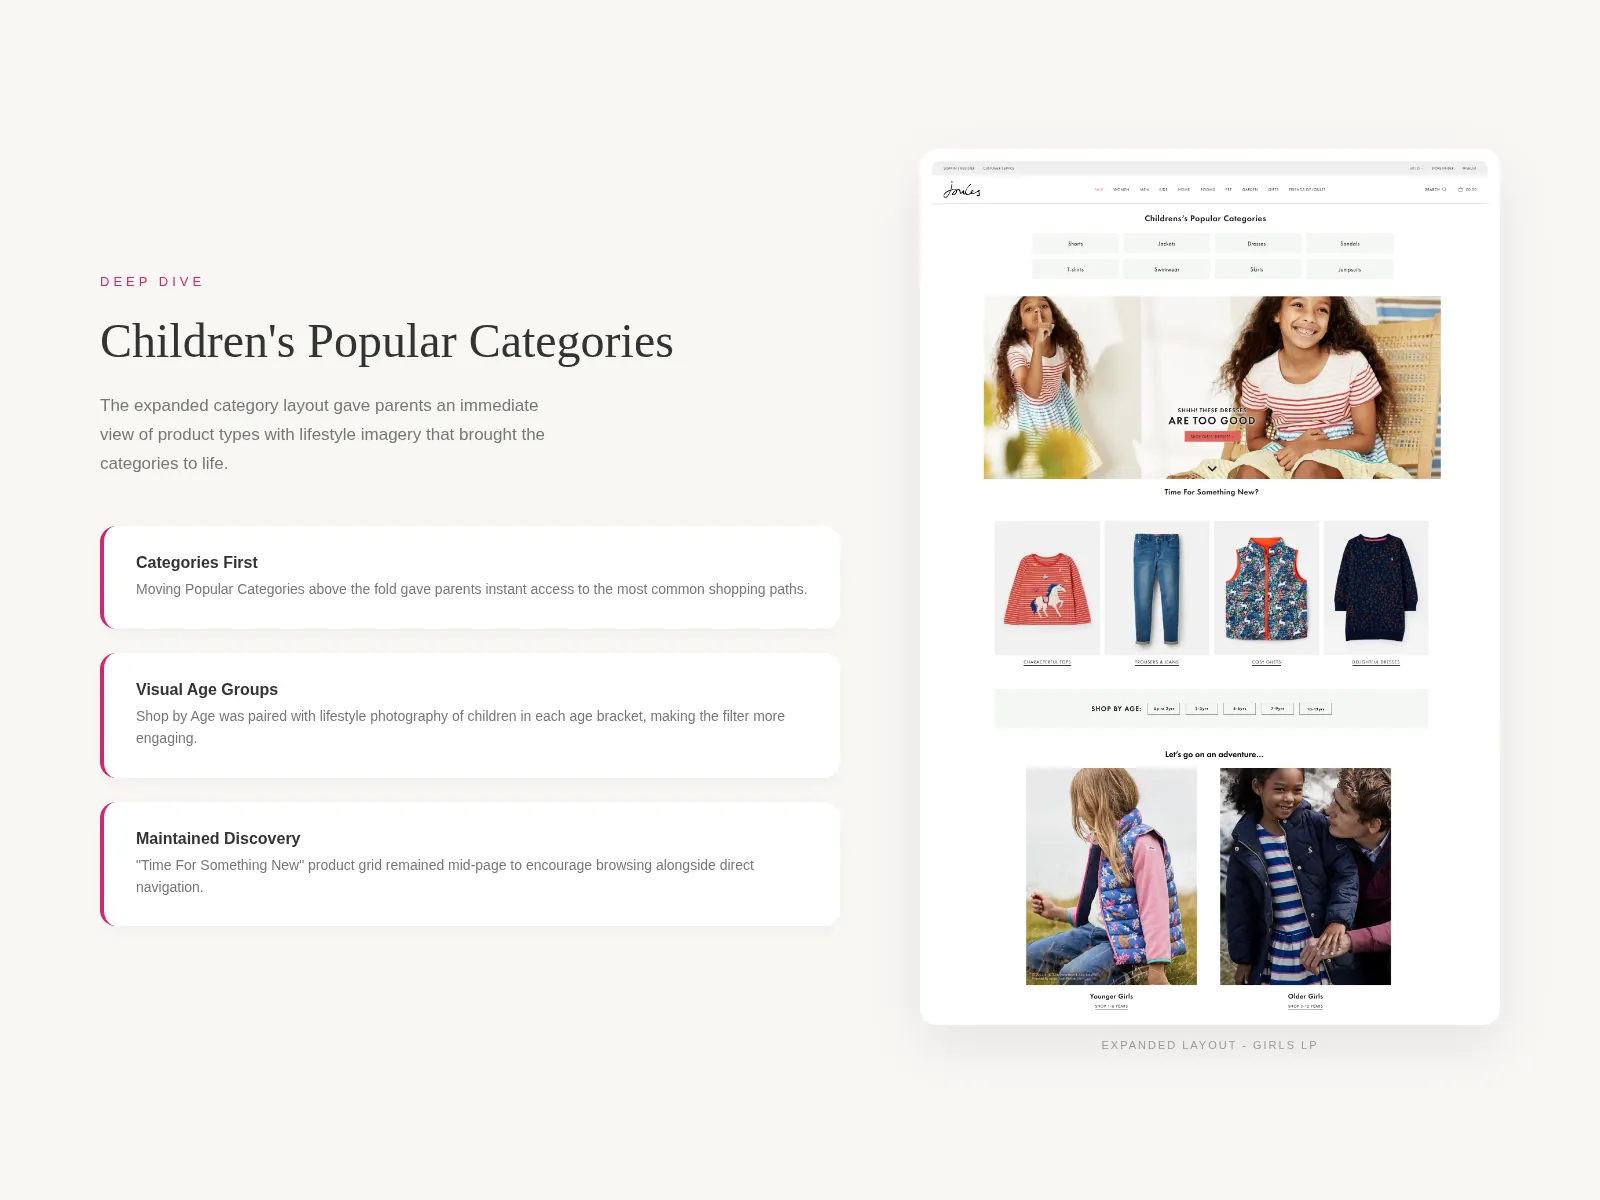
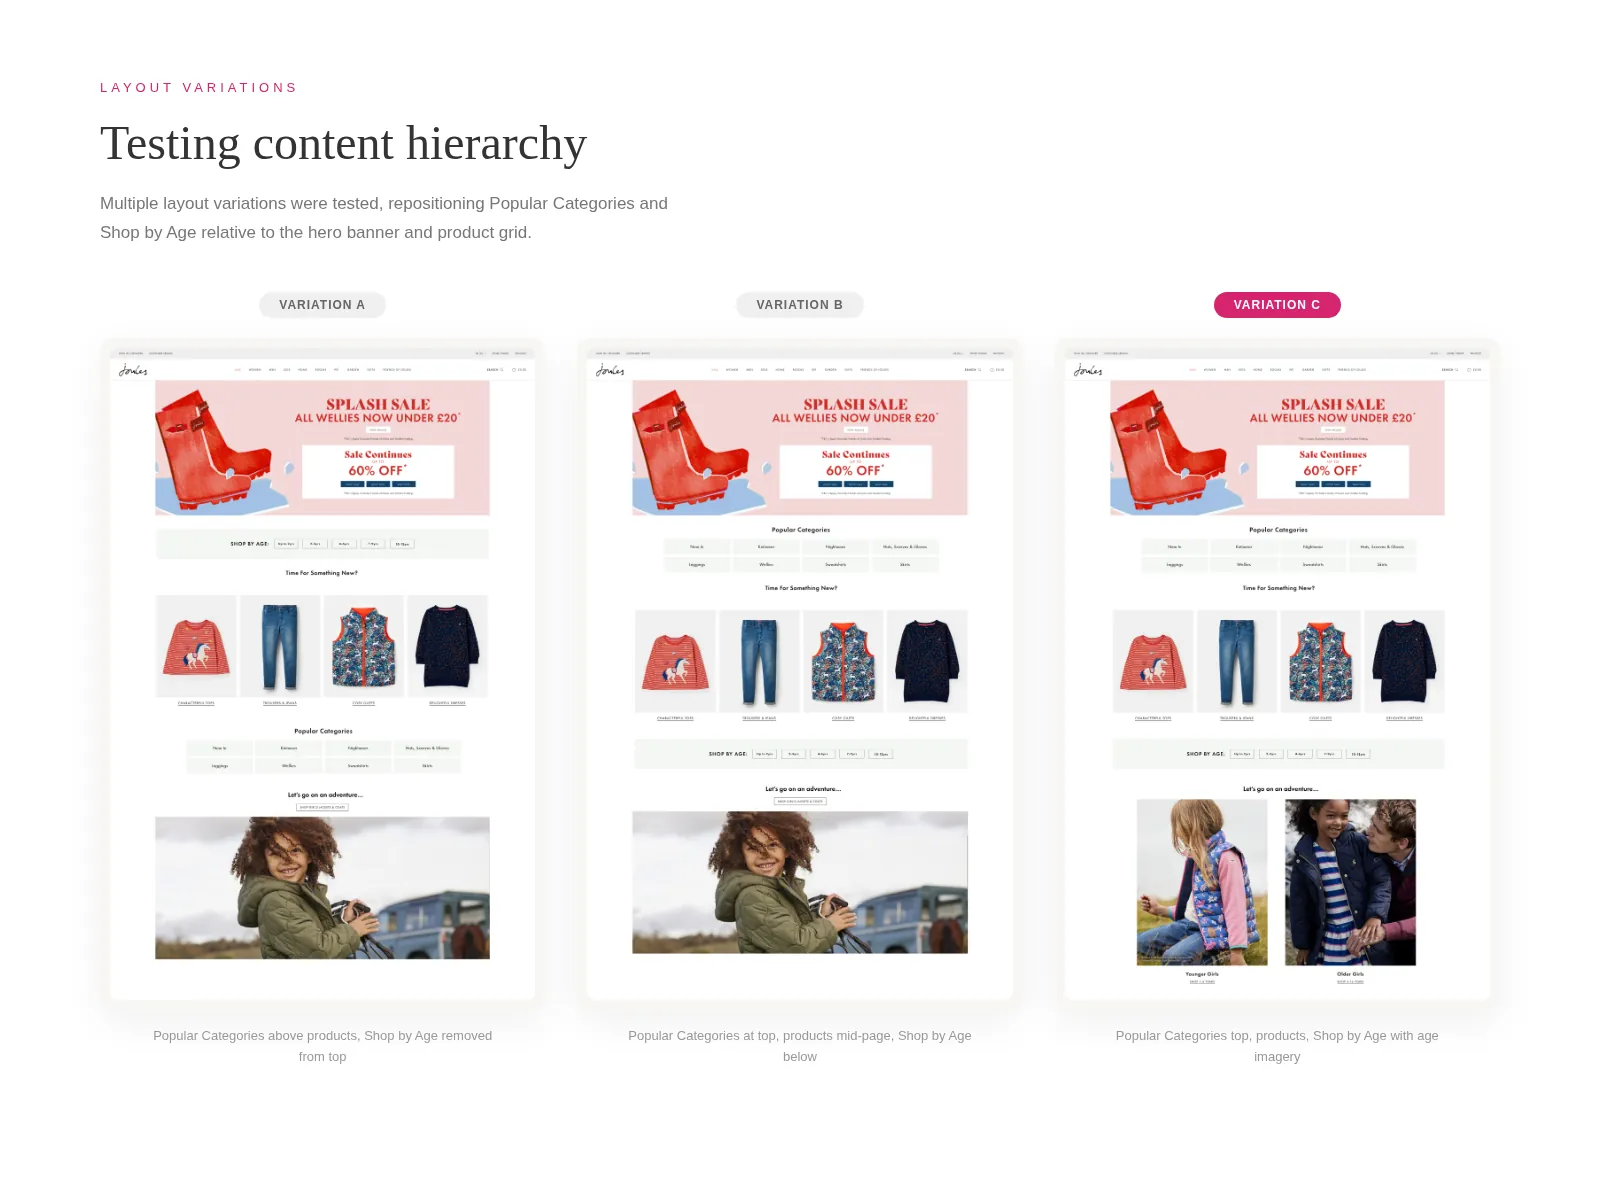
The filter test went through the most design iteration. The first variant pitched chips at the top of the page against a left-rail panel. Chips lost on first run, but the qualitative session replays suggested it was less about chips themselves and more about the specific four chips shown. We re-ran it with merchandiser-curated chips reflecting the top filters per category, and chips edged ahead. The lesson was about content, not container.
Card density was less interesting visually but more interesting commercially. A two-column mobile grid with smaller imagery beat the existing three-column-on-desktop / one-column-on-mobile setup, but only by a small margin. What made it worth shipping was that the average products viewed per session climbed noticeably: people were genuinely seeing more.
Collaboration
The analyst and I worked in lockstep. I wrote the hypotheses, she wrote the measurement plans, and we reviewed each other’s work before anything went live. That review caught at least two cases where I had specified the wrong primary metric and one where she had picked a sample-size threshold that would have given us a noisy read.
I also ran a Friday-afternoon “what we learned this week” with the wider team: fifteen minutes, screen-shared dashboards, no slides. It kept merchandising and the trading team in the loop without inviting them to litigate every decision in real time. By the end of the programme, the loudest stakeholder had become one of the strongest advocates, mostly because she could see her hypotheses being tested fairly rather than dismissed.
Outcomes
After the six tests, we shipped a combined variant: persistent filter state across navigation, a two-column mobile grid, and “Recommended” as the new default sort with the others one tap away.
The decision log became its own quiet win. Six months later, the team was still using it as the default reference when someone proposed a category-page change.
What I’d do differently
The wash periods between tests were generous and I would shorten them next time. One week was overkill given how rarely returning users hit the same category twice in that window. I would also have built a simple dashboard for non-technical stakeholders earlier; I made one in week ten, and I should have made it in week two.
Impact
Six A/B tests across category page filters, card density, and sort defaults, plus a documented decision log and a rolled-out winner combining filter persistence and a denser product grid on mobile.